
Where Body Composition Measurements Tend to Go Wrong

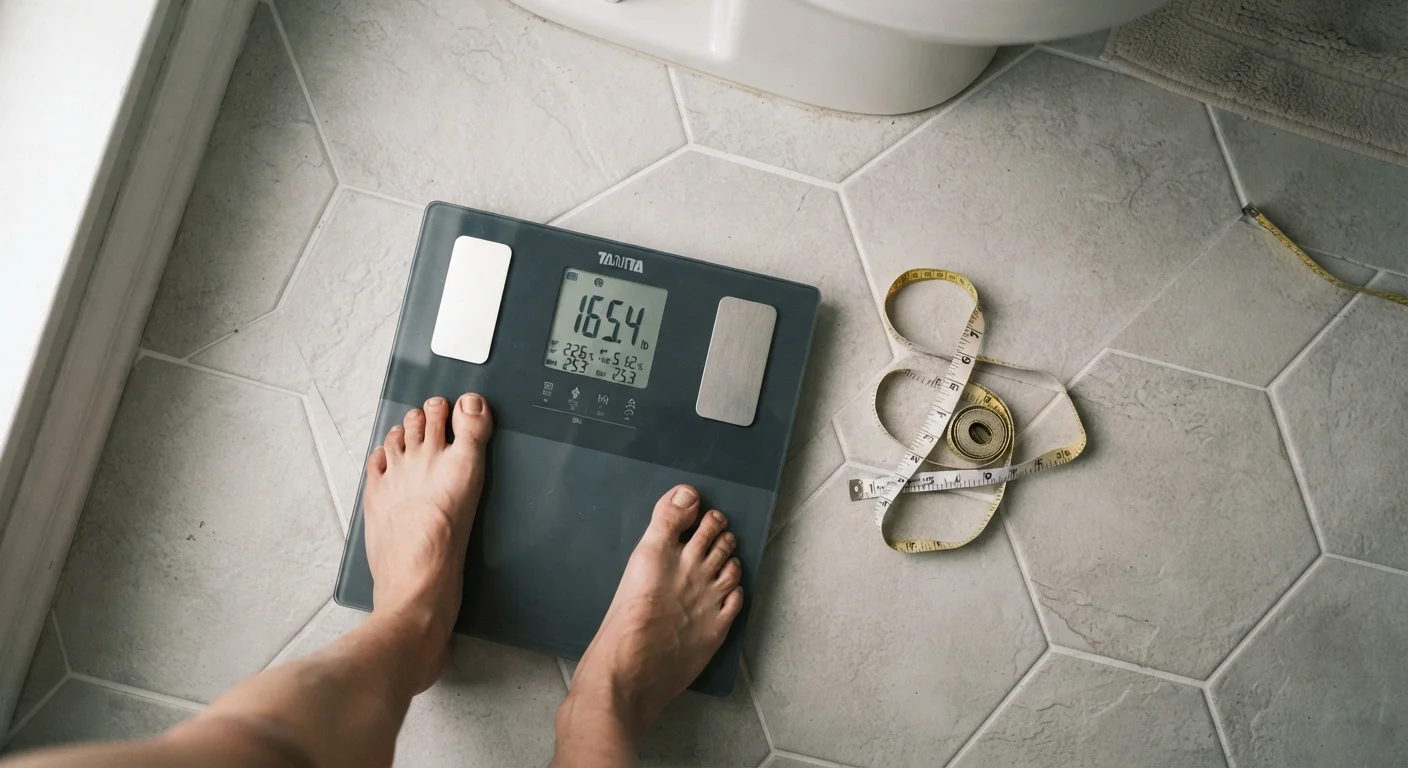
Photo: YetaWellness.com | Explore Trending Blogs editorial
Key Takeaways
- Hydration status is one of the largest sources of error in bioelectrical impedance analysis readings.
- Time of day, recent meals, and exercise all introduce variability that distorts body composition data.
- No single measurement tool is perfectly accurate - consistency in conditions matters more than any single number.
- Comparing results across different devices or methods is rarely meaningful due to differing algorithms.
- Understanding error sources helps you interpret trends rather than overreact to individual data points.
Why Body Composition Readings Are More Variable Than They Look
Body composition assessments - whether from a consumer bioelectrical impedance analysis (BIA) scale, a DEXA scan, or skinfold calipers - promise a window into what your body is made of beyond simple weight. But the numbers these tools produce are not direct measurements. They are estimates, derived from mathematical models and population-based equations that carry inherent margins of error.
Understanding where those errors enter the picture is essential for using the data productively. As explained in our overview of body composition metrics, the numbers on a scale alone tell you very little - and the same caution applies to body fat percentage readings when conditions aren't controlled.
The mistakes below are among the most common sources of measurement error. Recognizing them won't eliminate variability, but it will help you build a more reliable picture over time.
Common Measurement Mistakes and How to Avoid Them
Measuring at inconsistent times of day.
Measuring without accounting for hydration status.
Taking readings immediately after exercise.
Switching between different devices or measurement methods.
Ignoring the effect of recent food intake on readings.
Treating a single data point as a definitive result.
For a deeper look at how these errors interact with specific metrics like body fat percentage and waist-to-hip ratio, see our comparison of common body composition metrics.
Putting Measurement Error in Context
±3-8%
Typical BIA body fat error range
Studies comparing consumer BIA devices to reference methods like DEXA have found error ranges of 3-8 percentage points depending on hydration and device type.
~2%
Body water change from mild dehydration
Even mild dehydration - roughly 1-2% of body weight - measurably increases electrical resistance in BIA, artificially inflating estimated body fat percentage.
Up to 5 lbs
Normal weight fluctuation within a single day
Research on intraday weight variability shows that fluid shifts, food intake, and digestion can produce fluctuations of several pounds within a 24-hour period, affecting composition estimates.
Measurement error is not a reason to abandon body composition tracking - it's a reason to approach it with realistic expectations. Research consistently shows that trends over multiple consistent measurements are more informative than any single reading. A one-time body fat percentage result, taken under uncontrolled conditions, carries limited clinical meaning.
Because sex-based physiological differences also affect how body composition data should be interpreted, it's worth reviewing how body composition metrics differ by sex before drawing conclusions from your results.
For practical guidance on standardizing your assessment conditions, our article on getting more useful data from body composition assessments walks through preparation steps that meaningfully improve reliability.
This article is for general informational and educational purposes only and does not constitute medical advice. Consult a qualified healthcare professional for guidance specific to your health situation.
The content on this site is for informational purposes only and is not a substitute for professional advice. Always consult a qualified professional for guidance specific to your situation.