
Why Body Composition Metrics Look Different for Women Than for Men

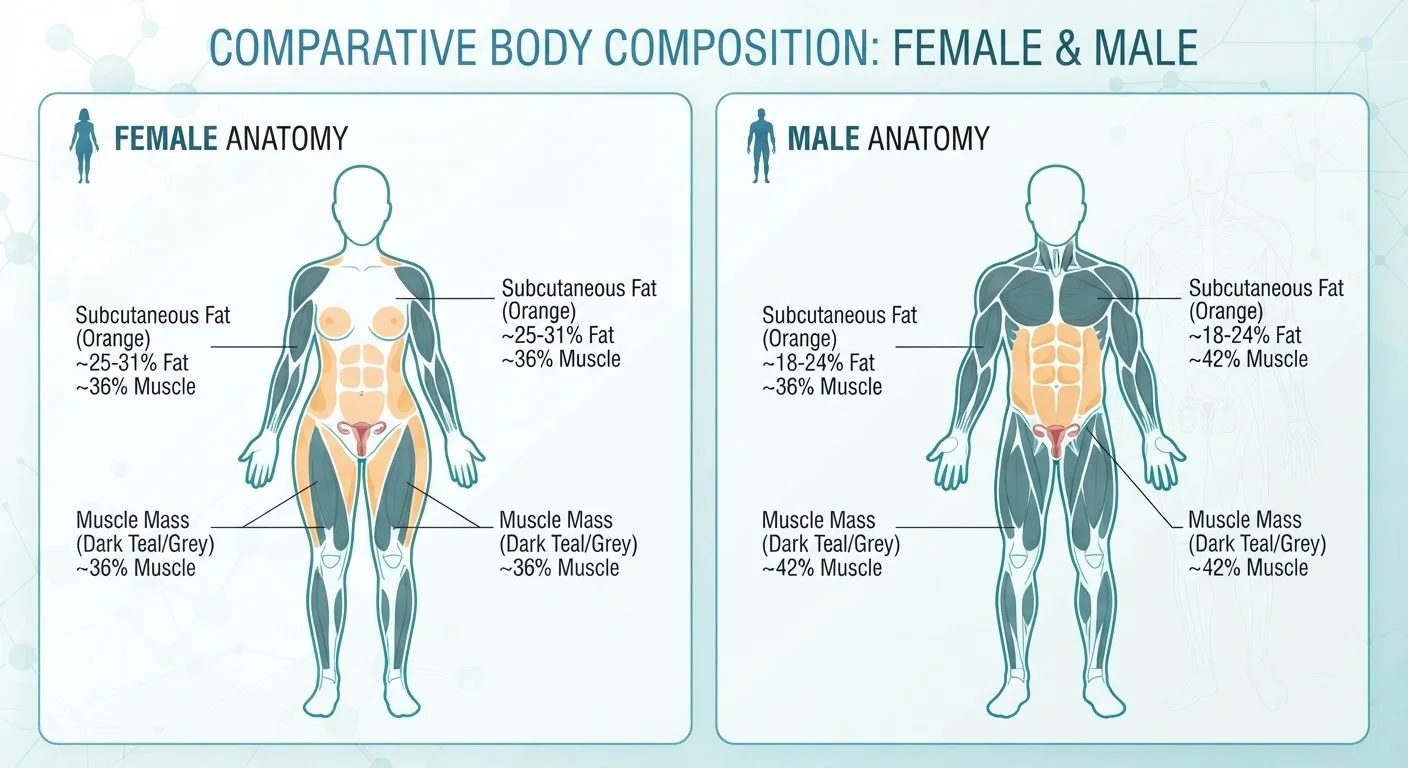
Photo: YetaWellness.com | Explore Trending Blogs editorial
Key Takeaways
- Women typically carry a higher percentage of essential body fat than men due to reproductive and hormonal physiology.
- Men generally have greater skeletal muscle mass and higher lean body mass as a share of total body weight.
- Fat distribution patterns differ significantly by sex - subcutaneous fat is more common in women, visceral fat in men.
- Standard body composition reference ranges are sex-specific and should not be applied interchangeably.
- Hormonal shifts across life stages, including puberty and menopause, further alter how fat and muscle are distributed.
The Biology Behind the Difference
Body composition is not a single number - it's a profile of how fat mass, lean mass, bone, and water are distributed throughout the body. For a foundational overview of these components, see our introduction to body composition.
When comparing biological females and males, the differences in that profile are consistent, measurable, and grounded in physiology rather than lifestyle. Three primary biological drivers account for most of the variation: sex hormones, reproductive physiology, and differences in skeletal structure and muscle fiber distribution.
Estrogen plays a central role in promoting fat storage, particularly in subcutaneous depots - the layer of fat just beneath the skin. Testosterone, present in much higher concentrations in males, supports greater muscle protein synthesis and a leaner body composition on average. These hormonal environments are established at puberty and continue to evolve across the lifespan.
A Note on Biological Sex vs. Gender
Essential Fat: Why Women Need More
One of the most clinically significant differences is the concept of essential fat - the minimum amount of fat required for normal physiological functioning. In females, essential fat is estimated at approximately 10-13% of body weight; in males, that figure is closer to 2-5%.
The higher threshold in women reflects fat's role in supporting reproductive hormone production, menstrual function, and pregnancy. Fat tissue is metabolically active and involved in synthesizing hormones such as estrogen. Dropping below essential fat levels can disrupt these functions - a phenomenon observed in athletic populations with very low body fat.
This is a key reason why healthy body fat percentage ranges are set higher for women than for men. A woman with 22% body fat and a man with 22% body fat are in very different physiological contexts, even though their numbers appear identical. For a comparison of how different metrics handle this, see our article on body fat percentage, BMI, and waist-to-hip ratio.
Fat Distribution: Where It Goes Matters
Beyond total fat percentage, where fat is stored differs significantly between sexes - and those location differences carry distinct health implications.
Women tend to accumulate fat predominantly in subcutaneous regions: the hips, thighs, buttocks, and breasts. This is sometimes called a gynoid or pear-shaped distribution. Men more commonly accumulate fat in the visceral region - surrounding the abdominal organs - sometimes referred to as an android or apple-shaped pattern.
Visceral fat is metabolically more active in harmful ways. It is more strongly associated with insulin resistance, elevated triglycerides, and cardiovascular disease risk than subcutaneous fat. This partly explains why waist circumference and waist-to-hip ratio are clinically useful indicators of cardiometabolic risk that must be interpreted with sex-specific cutoffs.
Importantly, hormonal changes alter these patterns over time. After menopause, the relative protection women have against central fat accumulation diminishes, and abdominal fat distribution becomes more common. This is discussed further in our article on how body composition shifts across the lifespan.
Muscle Mass and Lean Body Composition
On average, men have substantially greater skeletal muscle mass than women - research estimates the difference at approximately 30-40% more total muscle mass, adjusted for body size. This gap emerges during puberty under the influence of testosterone and growth hormone, and it persists into adulthood.
Lean body mass - which includes muscle, bone, and organ tissue - is generally a larger proportion of total body weight in men. This affects resting metabolic rate, since muscle tissue burns more calories at rest than fat tissue does. It also means that body weight alone is an especially poor indicator of health status when comparing across sexes.
Women respond robustly to resistance training and can achieve significant gains in strength and lean mass, though the absolute values typically remain lower than men's due to hormonal differences. This does not reflect a limitation - it reflects a different baseline. For more on how muscle and fat tissue behave differently in the body, see our article on muscle vs. fat.
10-13%
Essential body fat threshold for women
Compared to 2-5% for men, reflecting women's reproductive and hormonal physiology requirements.
~36%
Greater average muscle mass in men vs. women
Research consistently shows men carry substantially more skeletal muscle mass, largely due to higher testosterone levels.
20-25%
Healthy body fat range for adult women (approx.)
Healthy ranges vary by age and source, but women's norms are meaningfully higher than men's equivalent ranges of roughly 10-20%.
Measurement Accuracy and Sex-Specific Reference Data
A practical consequence of these biological differences is that body composition measurement tools must use sex-specific equations and reference ranges to produce accurate, meaningful results. Many widely used tools - including bioelectrical impedance analysis (BIA) devices and certain skinfold protocols - were originally developed and validated using predominantly male samples. Applied to women without adjustment, they can systematically over- or underestimate fat mass.
Menstrual cycle phase also introduces variability in women's measurements. Fluid retention and hydration status shift across the cycle, and because BIA and similar methods use water content to estimate body composition, readings can fluctuate by several percentage points depending on the day of measurement. Our article on where body composition measurements go wrong covers these sources of error in more depth.
For anyone tracking body composition over time, using consistent conditions - same time of day, same cycle phase where applicable, same device - improves the reliability of comparisons. The goal of these metrics is to provide useful information, not to generate numbers that inspire anxiety. Consulting a healthcare professional helps contextualize results within individual health history.
This article is for general informational and educational purposes only and does not constitute medical advice. Always consult a qualified healthcare professional for guidance specific to your health situation.
Frequently Asked Questions
The content on this site is for informational purposes only and is not a substitute for professional advice. Always consult a qualified professional for guidance specific to your situation.